Speakers
- Julien Pivotto
- Malcolm Holmes

Area of research, Jsonnet. Used to template JSON files. NB There was a talk re Kubernetes Jsonnet usage yesterday.
Aim to provide consistency and improve reusability of dashboards.
on web development.
Speakers
Area of research, Jsonnet. Used to template JSON files. NB There was a talk re Kubernetes Jsonnet usage yesterday.
Aim to provide consistency and improve reusability of dashboards.
By Florian Lautenschlager & Robert Hoffmann
They are building a GDPR compliant voice assistant that give users control over personal data.
Lovely but not usable by their team.
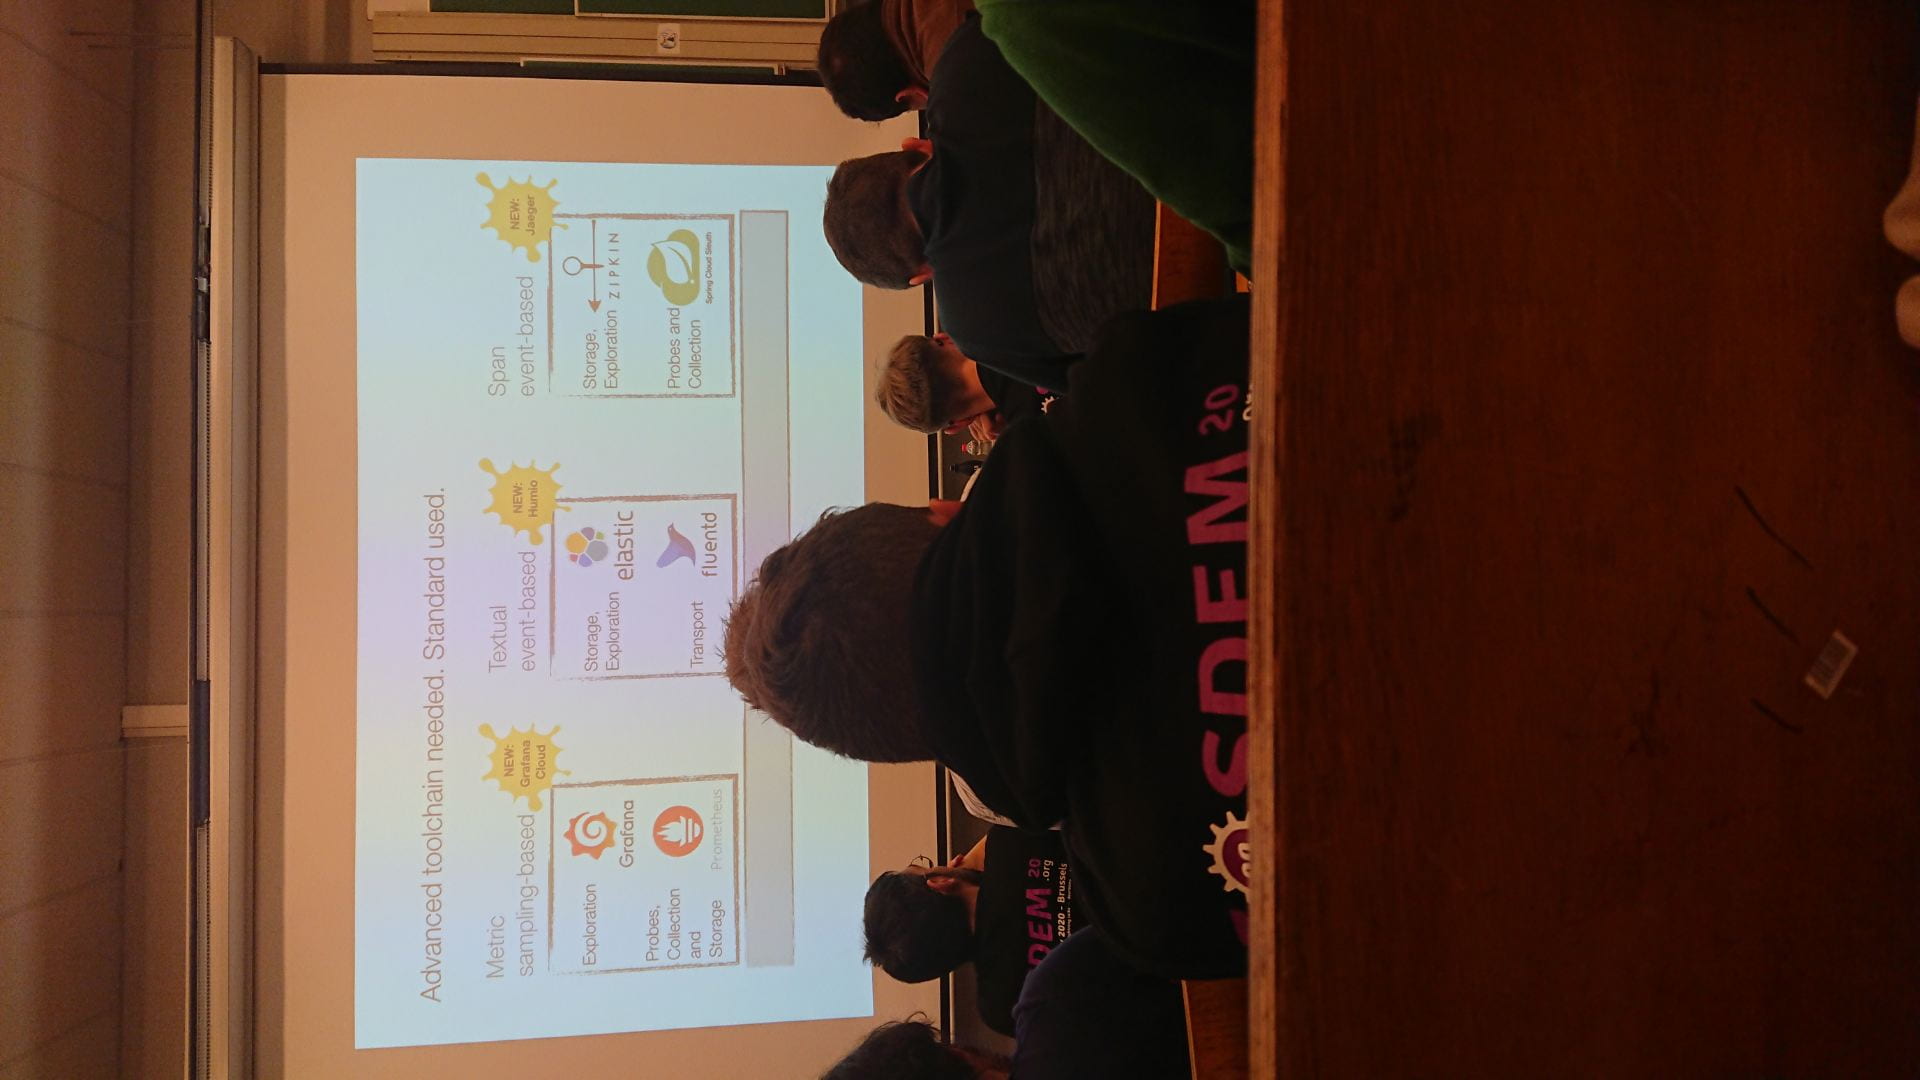
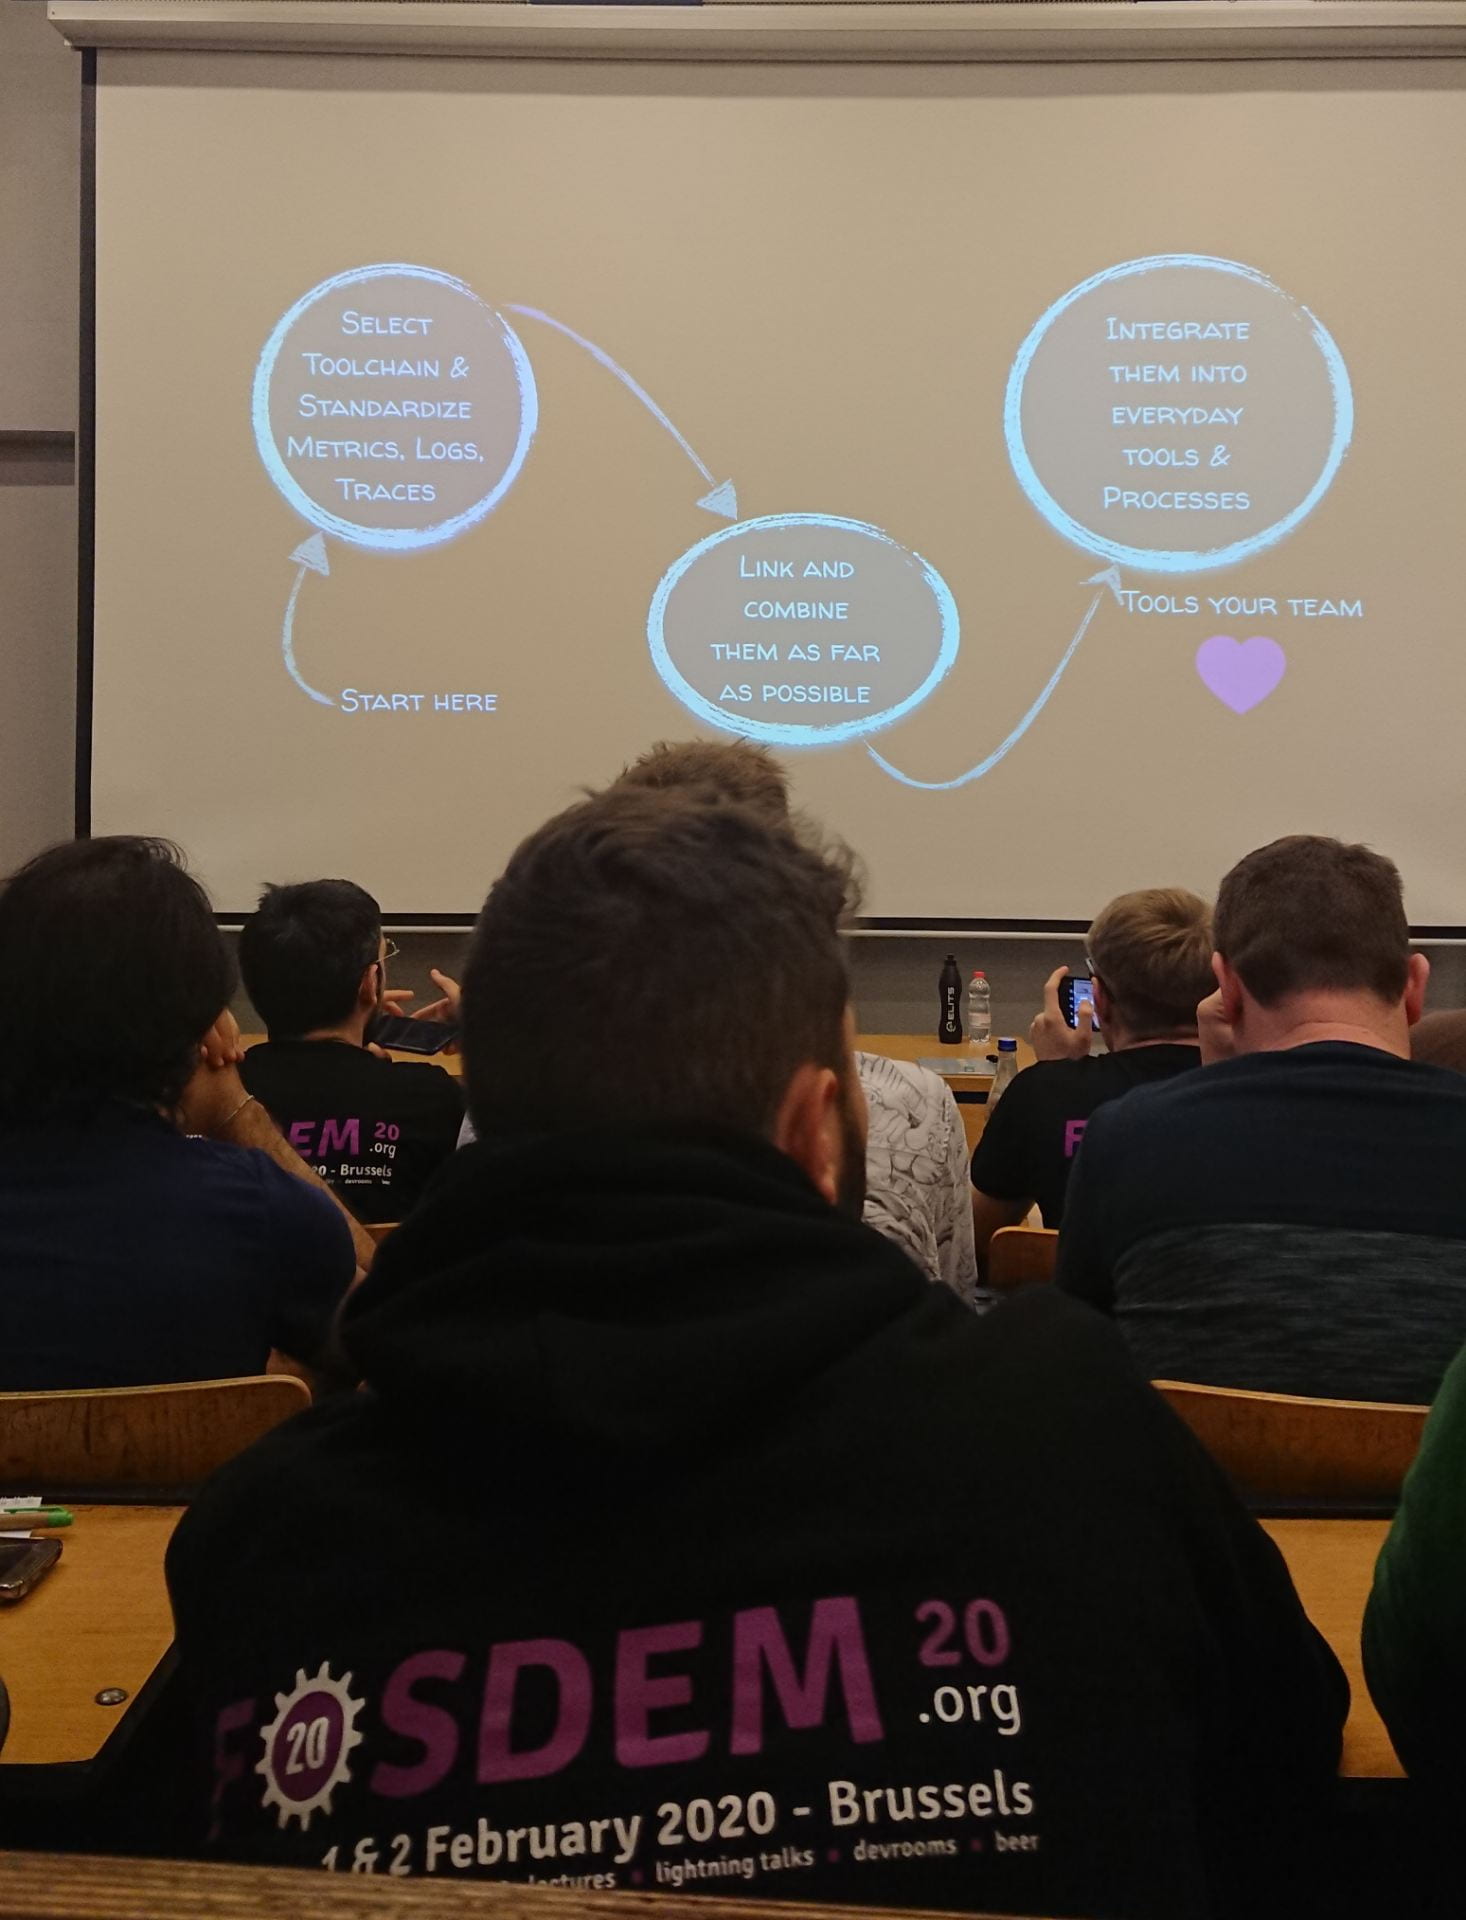
How did they improve the usage and culture in their organisation to their monitoring toolkit.
E.g. Adding links from metrics re tests failing to system logs related to that test.
Create a dashboard to facilitate frequent queries, e.g. Search by trace id or username.
Also they integrated the links into commonly used tools, like ticket systems or chat tools.
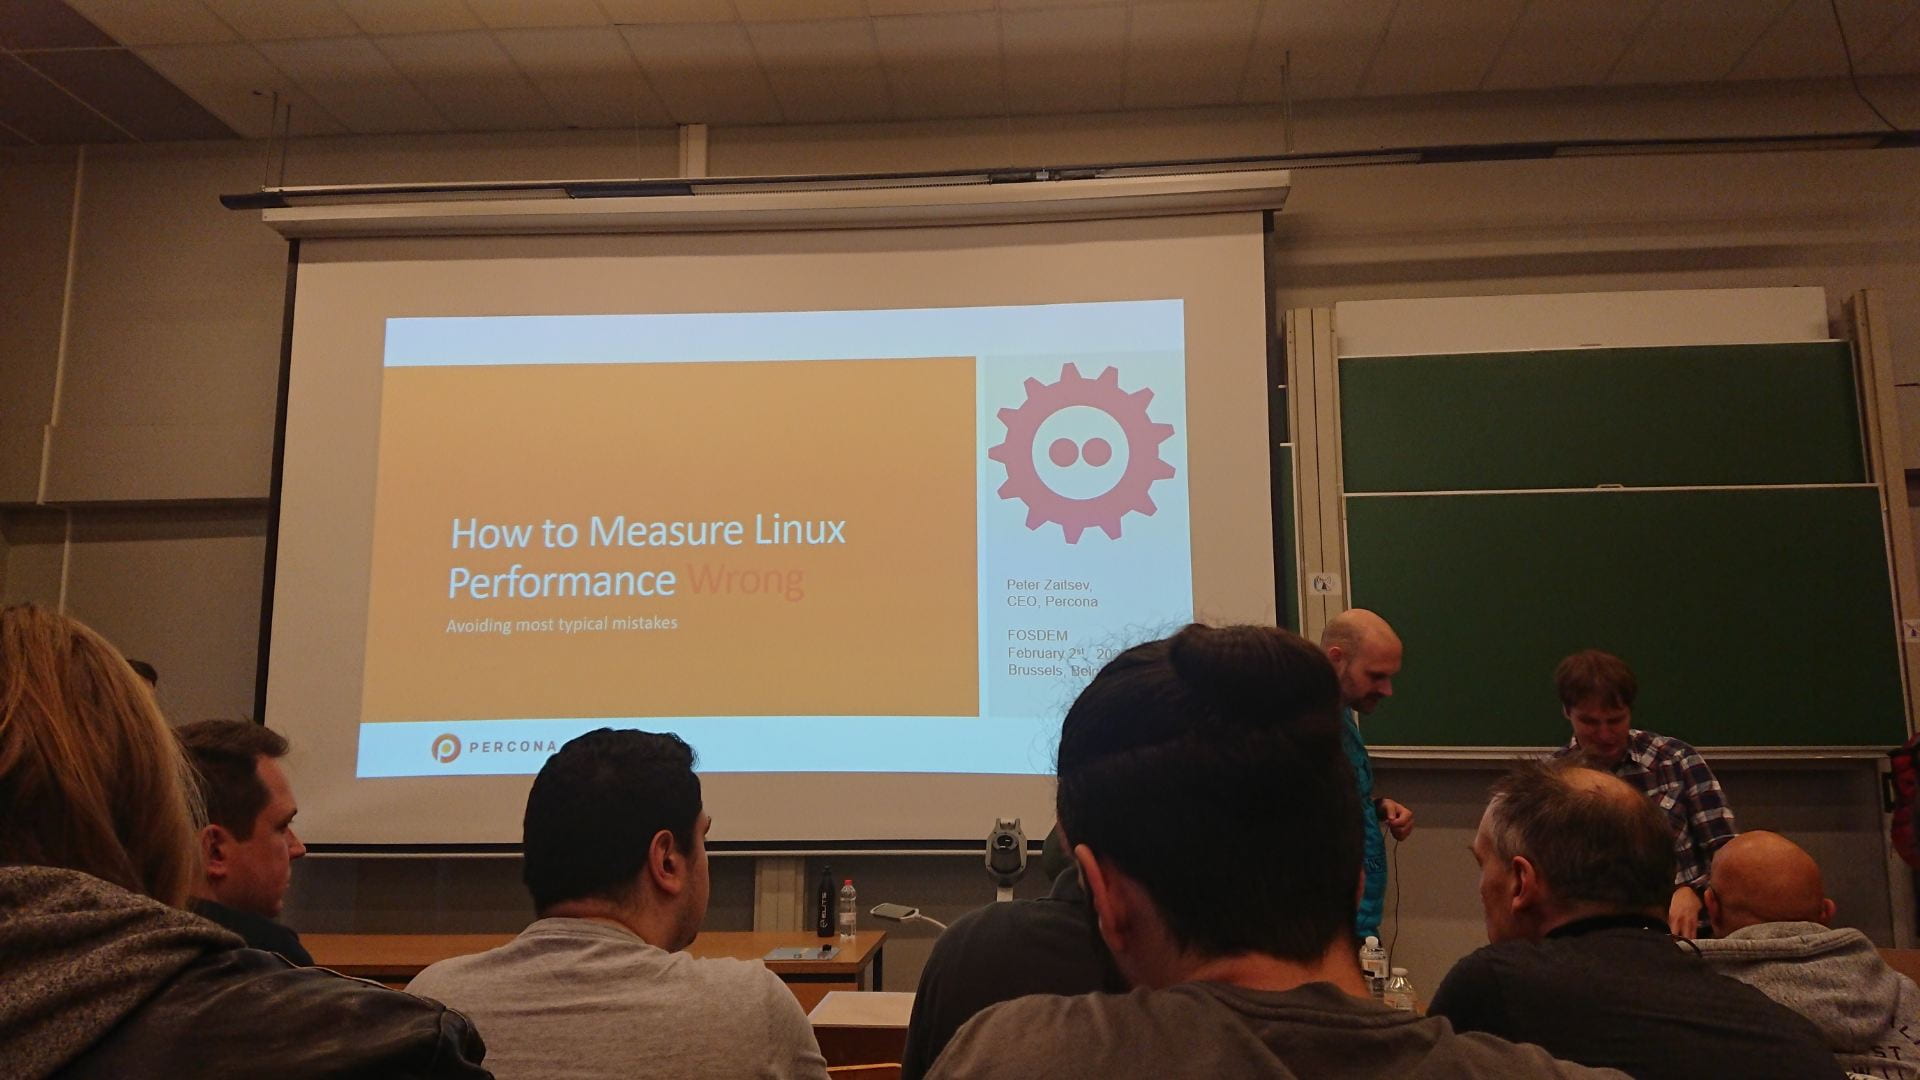
By Peter Zaitsev from Percona
Concurrency & latency
CPU
Look up USE method, e.g. Brendan Gregg
LoadAvg is interesting but what are the resources of the machine? Also this blurs IO and CPU usage.
Look at Saturation metrics, normalised load and ??
PSI – new feature Pressure Stall Information
Look runqlat a command line tool to look at run queue latency
CPU states to not:
IO wait is idle
Steal is CPU not available to your VM
Disk space used vs file length, think sparse files. These are missed in du – sh commands.
free look at available memory not free memory running out.
ping or mtr?
Area of research bcc tools
Speakers:
Observability, example load balancer app:
Examples how many requests result in an error?
What about whether loaad balancer is fairly distributing the requests?
Does the load balancer introducing latency?
Prometheus metrics being promoting, quick, easy, scalable?
This was then visualised using grafana.
Do not confuse metric gathering and logging.
Unit test your metric instruments
By Efraim Flashner
Very funny slides.
Using guix to help package and deploy a crazy 2010 PHP web app.
Area of research Octave